|

Shocked Bubble Experiments and Computations
Experiments studying the
unstable growth of a dense spherical bubble in a gaseous medium, subjected
to a strong planar shock wave (2.8 < M < 3.4), are performed in a
vertical shock tube. The test
gas (argon) is contained in a freely-falling (in N2) spherical
soap-film bubble, and the shocked bubble is imaged using planar laser
diagnostics. Concurrently,
simulations are carried out using a 3-D compressible hydrodynamics code,
Raptor.
Experiments and
computations show consistent results, indicating the formation of
characteristic vortical structures in the post-shock flow. The results emphasize the significance of 3-D effects, and of small
non-uniformities in the initial bubble geometry. Further, the time-behavior of flow features is analyzed, showing
that, under some conditions, the development of the unstable interface can
be parameterized for variable shock strength.
Bubble Development:
| t = |
time since initial shock/bubble contact |
| t
= |
characteristic time, t=D/up, where
D is the initial bubble diameter and up is
the particle speed of the shocked gas (M=2.88, t=
68.2 ms) |
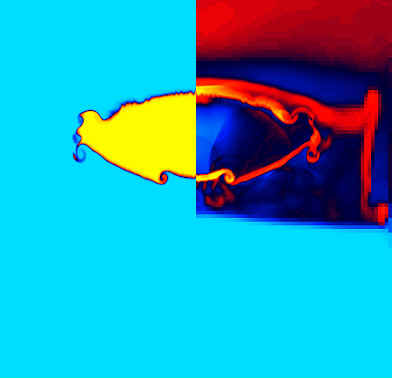
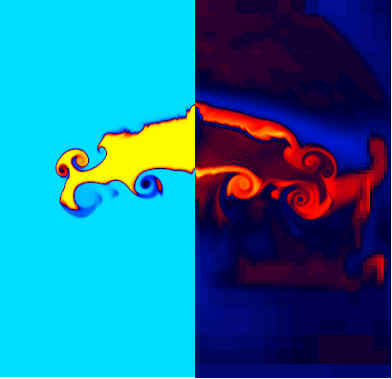
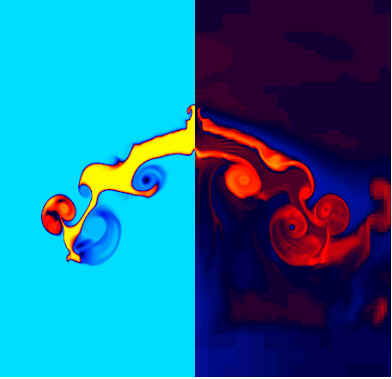
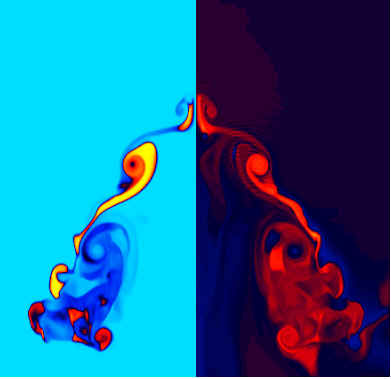
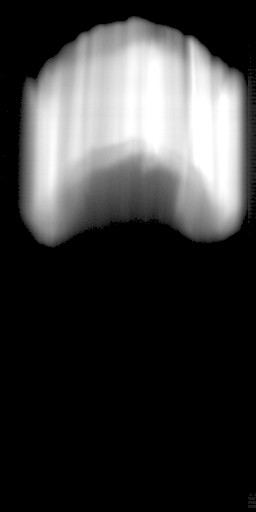
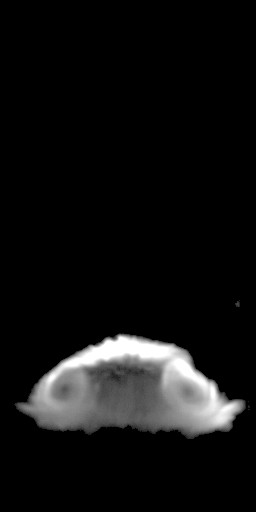
Below: Numerical results, Ar volume fraction
(left) and total density (right) plots at midplane.
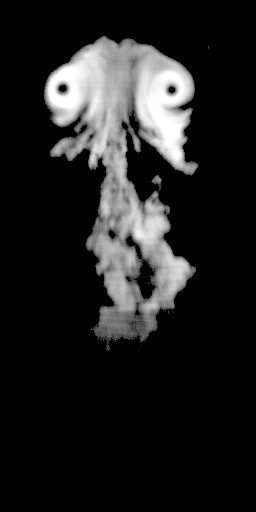
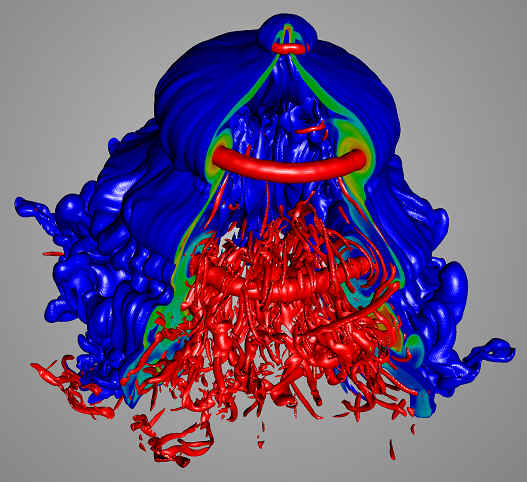
Right:
Late-time (t/t=7.91) image and 3-D rendered plot showing
multiple vortex rings and complex 3-D structure
- Blue: Ar vol. fraction=0.1
- Red: vorticity magnitude
- Green: film material plotted on cuts
|
 |
 |
| 3D evolution of the M=2.88 shock
accelerating the Ar bubble. The planar shock wave contacts the top of the bubble and refracts through it.
The bubble is initially compressed into a disk and then the
major (and minor) vortex rings are formed as the shock wave
moves downstream. This animation is a reduced version of
that which was shown at the 58th annual Division of Fluid
Dynamics (DFD) meeting of the American Physical Society (APS),
November 20-22, 2005, Chicago, IL during the presentation "Interaction
of a planar shock wave with a spherical gas inhomogeneity. Part
II: calculations", by John
Niederhaus, Devesh Ranjan, Mark Anderson, Jason Oakley, and
Riccardo Bonazza. The
original high resolution mpeg (1024x1024 pixels, 1356 frames)
animation can be downloaded
here (huge, 38 MB).
Animation
credits from LLNL are: Jeff Greenough, Hank Childs,
Rebecca Springmeyer, and Eugene Cronshagen. |
|
 |
Growth trends:
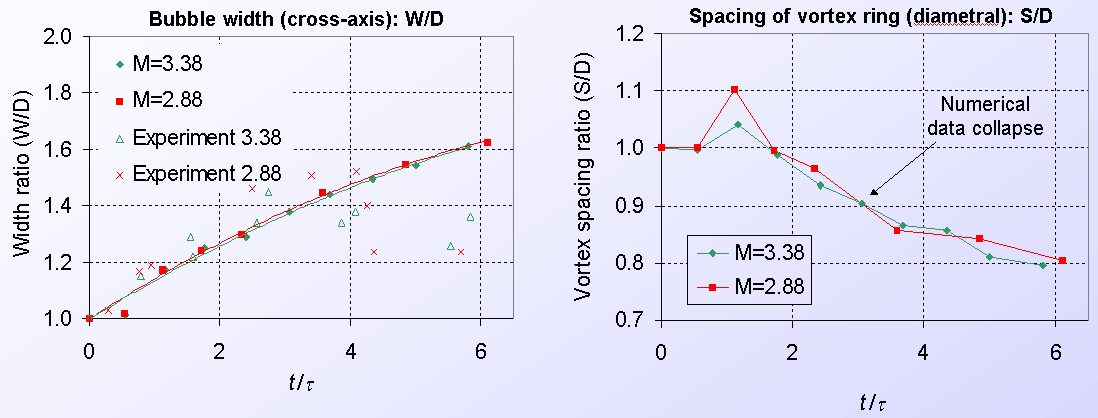
Selected flow features are tracked over time, with parameterization using the shocked particle speed up
(t = D/up). Flow features shown here are the maximum transverse bubble width
(W) and the spacing (S), or primary diameter, of the major vortex ring (numerical only). Reasonable agreement with computations (closed data points) is found for early times
(t < 3.5), and both experimental and computational data collapse with this scaling, for these Mach numbers. Further experiments and calculations have shown that such a collapse is not achieved at lower shock strength, where compressibility effects can come into play.
Reshocked Bubble Experiments
An experiment for a reshocked bubble is shown below. A spherical soap bubble
filled with Ar has been accelerated by a M=2 shock wave and is translating
downward in a N2 atmosphere. The bubble appears as a blurred vortex pair in the first
image (a) which is a planar cross-section of the vortex ring. The shock wave,
which is down-stream of the bubble, is reflected from the end-wall of the shock tube and
accelerates the bubble upward. Image (b) is the first image of the reshocked
sequence and the blur from this point onward is greatly reduced since the absolute velocity of the
bubble is now much smaller. The latest image in the reshock sequence is (c) and a large amount
of the bubble mass has been stripped from the vortex ring, however, the ring with its core (which
appears black) is still very much intact. An animation (d) of this image sequence at a frame rate
of 10 fps (recorded at 10,000 fps) shows the evolution of the reshocked bubble.
A particle imaging velocimetry (PIV) technique has been performed on a time series of images
and is shown below. These data are from an Ar filled soap bubble in a N2 atmosphere
which has been accelerated by a M=1.33 shock wave. The raw data is filtered and smoothed
during the PIV operation and from the velocity vector field data the circulation field data is obtained.
The horizontal, dashed magenta line in the circulation plot is the average location of the vortex ring's core
as determined by averaging the center of the cores on the left and right of the planar image.
The y-velocity of the ring cross-section at the core location is plotted to the right of the
circulation field. The black line is the velocity at a each time step and the dashed red line is
the running average of the velocity at the core location. The cores are moving upward (positive y-velocity)
as is apparent in the circulation image movie, but the PIV technique also reveals a stronger velocity
field on the ring's axis which is moving in the opposite direction to the core. This is shown as the
horizontal green line which is an average of the maximum (typically core location) and minimum (typically
axis location) and is negative.
|