|
|
|

 |
|
Shocked Water Layer ExperimentsIn the conceptual design of inertial fusion energy (IFE) reactors, the chamber walls require protection from high energy X-rays that occur during the fusion reaction. Liquid layer(s) or jets of a breeding material, such as Flibe (Li2BeF4), have been proposed in several protection schemes. Following the initial interaction of the x-rays with the liquid, it is essential to understand the shock hydrodynamics associated with the liquid layer break-up and the shock acceleration of the layer and its effect as it impinges on the reactor chambers' first wall. Liquid layer break-up is important to understand when analyzing the chamber's vacuum clearing system, and also, the amount of break-up has an effect on the pressure loading on the first wall. Figure 1 is a schematic of an experiment conducted at the WiSTL. A horizontal water layer (blue) is placed in the vertical shock tube and is supported by a thin Mylar film and equal-spaced nylon filaments spanning the width of the shock tube. A shock wave with speed W travels down the shock tube having accelerated the shocked gas behind it (yellow) to a particle velocity up. The shock wave interacts with the water and a shock is reflected off the upper surface of the water layer (WR) and a shock is transmitted (WT) and the water accelerates with a velocity ur. The initially flat layer begins to break up and spread out, as noted by the layer thickening and the wavy surfaces, and is accelerated into the test section where it can be imaged through the circular window. At later times, the transmitted shock wave reflects off the end-wall of the shock tube and is accelerated back up with a velocity WTR, and in the final image, a shock is transmitted through the layer and travels back up the shock tube.
Studying the break-up of the water layer, due to the shock interaction, is accomplished through several imaging techniques: shadowgraphy (Fig. 2) , planar light sheet (Fig. 3), front-lit high speed cinematography (2 megabyte avi), and X-ray transmission (Fig. 4). In each of the experimental image montages shown, only one image is obtained per experiment so adjacent images have been obtained in successive experiments. In shadowgraphy, a collimated, pulsed, light beam is steered through the large quartz windows on each side of the shock tube onto a screen. At the onset of the experiment the camera shutter is opened, and when the water sheet is in the test section, the light source is pulsed. The first of the three images in Fig. 2 is the leading edge of the water sheet, initially flat and 6.4 mm thick, 1.32 ms after it has been accelerated by a M=2.68 shock wave. The transmitted shock wave is also seen at the bottom of the viewing area (since this imaging senses the second spatial derivative of density gradients.) The initially flat layer has undergone a severe amount of break-up and the lack of left-right symmetry is notable. Arcs seen as dark lines are very weak shocks reflected off a small gap in the shock tube wall. In the later time images at 1.43 and 1.47 ms, the water layer is observed moving downward with a bulk velocity while further break-up at the leading edge is observed. Three images from a planar light sheet imaging campaign are shown in Fig. 3. A laser beam is projected up through a window in the bottom of the shock tube, parallel to a window surface, and the leading edge of the water layer is imaged by reflecting light into the camera. Qualitatively, the amount of break-up for this lower Mach number (2.14) and thicker water sheet (12.8 mm) experiment is similar to the shadowgraph images; however, more detail is seen at the leading edge and a gray scale, somewhat proportional to the density, is observed at 2.62 ms.
Figure 4 shows a series of 4 X-ray for an initially flat 12.8 mm thick water sheet subjected to a M=2.12 shock wave. The quartz windows have been replaced by smaller, thin carbon fiber windows that are optically opaque but appear transmissive to X-rays (150 keV maximum, 70 ns pulse). A fluorescent screen, on the opposite side of the shock tube than the X-ray head, is excited by the transmitted X-rays and the image is captured with a digital camera. Figure four is arranged so the leading edge of the disrupted water sheet is on the bottom, the trailing edge on the top, and the bulk of the water is in the middle two images. By constructing the image in this way, the overall water density distribution can be obtained in four separate experiments because the water layer has stretched out to over 20 cm (20 times the initial thickness) in the 3.2 ms timespan. The volume fraction images have been obtained from the actual X-ray images (through a detailed calibration process) and the regions with no water are black, while the regions with a high volume fraction of water are light. A region of interest is shown as a tall, narrow rectangular box and this is used to construct the linear volume fraction through the layer. This integration technique allows for a reconstruction of the average water volume fraction throughout the entire thickness. A peak volume fraction of 22% is observed at 8 cm above the leading edge of the layer, and then the density decreases at a slower rate than it was steepened and ripples are observed in this trailing edge portion. Although the leading edge experiences significant break-up, as seen in Figs. 2 and 3, it is evident from the X-ray image analysis that there is even more break-up at the trailing edge of the layer.
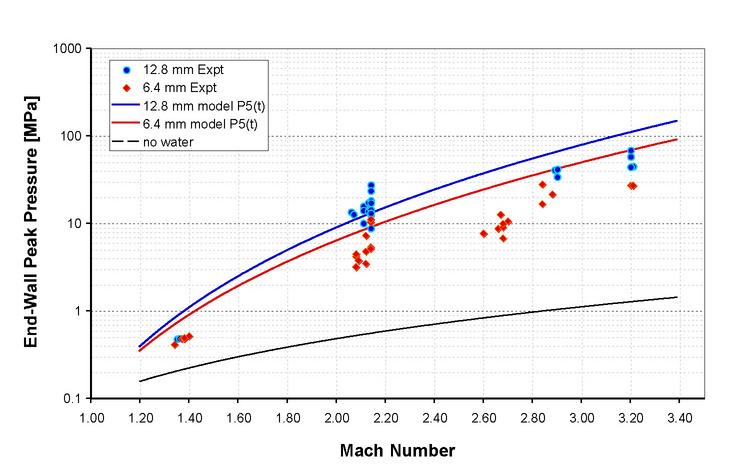
The end-wall peak pressures measured in the experiment are shown in Fig. 5. These pressures are not due to the transmitted shock wave (WT), but instead, are due to the momentum of the water layer compressing to a zero velocity at the end-wall of the shock tube. These pressure are typically much higher than would be associated with the reflected shock wave. The thicker water layer, 12.8 mm versus 6.4 mm, typically results in a higher value of the peak pressure, as would be expected for more mass, and therefore, more momentum. A new analytical model (one-dimensional) for predicting the peak pressure (labeled P5) is compared with the experimental data. The isentropic model is generally considered to calculated a conservative value of the peak pressure, however, at M=2.2, there are data that fall above the model. A most significant result of these experiments are the extremely high pressures associated with the water layer acceleration from a strong shock wave. In the IFE reaction, the shock strengths could me much higher (up to M=20) and therefore, the hydrodynamic shock loading on the chambers first wall needs to be a fundamental consideration in the design.
|