|
|
|

 |
|
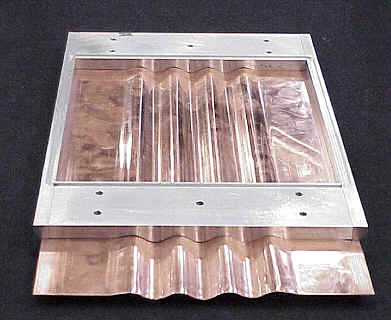
The Richtmyer-Meshkov Instability Utilizing the Rayleigh-Taylor Instability for the Initial Condition
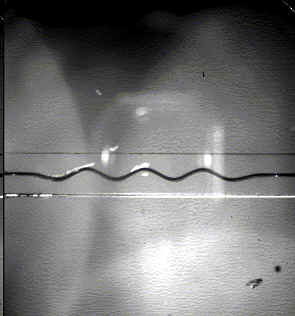
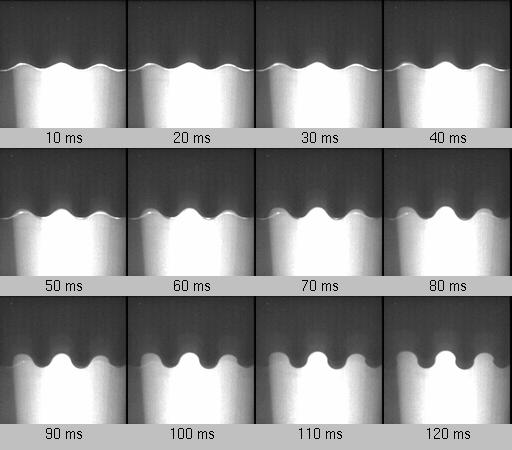
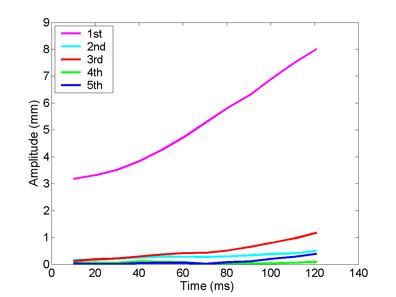
The RT development is shown in Fig. 3. The initial perturbation (cosine, h0=3.2 mm, l=38.1 mm) grows in amplitude and remains predominantly sinusoidal in nature until approximately 110 ms.
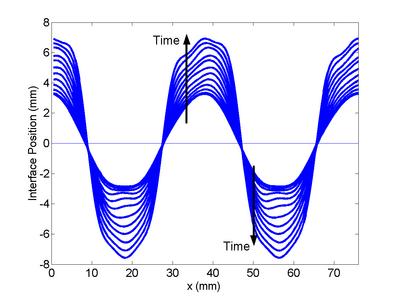
The experimental images are analyzed with an image processing algorithm to determine the location of the interface. Two full wavelengths are analyzed and the results are shown in Figs. 4 and 5. Fourier analysis is only possible up to 120 ms because at this time there are portions of the interface where there are multiple ordinates for a given abscissa. The dominant modal growth is the fundamental with the third harmonic being the next highest at later times.
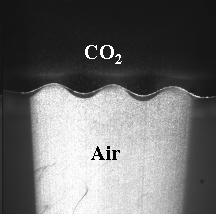
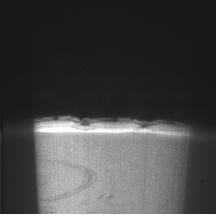
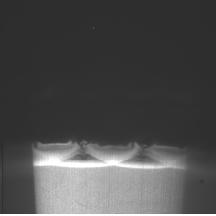
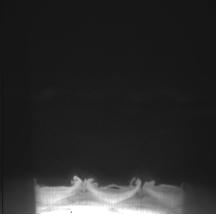
A strongly shocked (M=3.06) interface is shown in its initial developmental stages in Fig. 6. Each image was obtained in a separate experiment with a similar initial condition. In Fig. 6a the edge of the copper sheet is seen reflecting light prior to being withdrawn through the wall of the shock tube. This type of interface is referred to as slow-fast (SF) because the shock travels from the gas with the slower sound speed (CO2) into the gas with the faster sound speed (air). Typically, the first gross phenomena seen in a shocked SF interface is the compression and flattening of the interface which is shown clearly in Fig. 6b. Then, a phase reversal occurs, and what was initially a peak becomes a valley that grows in amplitude, and vice-versa, Figs. 6c-d. This reversal phenomena can be contrasted to that of a fast-slow interface where a peak is compressed and then grows in amplitude. The shock wave can be seen in Figs. 6b-c as the bright line directly beneath the interface- the initially planar shock wave, which would appear as a line in two dimensions, has been distorted by refraction through the SF interface. Later stages of the instability development are shown in Fig. 7. The amplitudes have grown dramatically in Fig 7a, and after approximately 1 ms of being shocked, the images (Figs. 7b-d) suggest the flow is transitioning to a turbulent mixing layer.
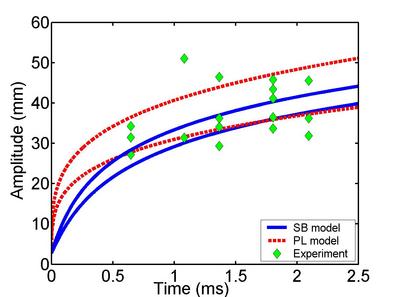
The peak-to-peak amplitude of the shocked interface is measured and plotted in Fig. 8. The experimental data is plotted in green points and is compared to the evaluations of two analytical models. The images in Fig. 7 show a turbulent mixing region, however, the bubble and spike nature are still evident, thus, the data is compared to an analytical model in each class. The models are evaluated twice, at the low and high values of the initial data (since the amplitude of the shocked interface varies from shot to shot, primarily due to the uncertainty of diaphragm rupture time, +/- 20 ms). The spike-bubble model (SB) shows less sensitivity to the initial condition and therefore less spread at later times. The experimental data compares more favorably with the turbulent-mixing-layer power-law (PL) model over the entire range of time considered.
For more details on this work, please see: Puranik, P. B., J. G. Oakley, M. H. Anderson and R. Bonazza, Experimental study of the Richtmyer-Meshkov instability induced by a Mach 3 shock wave, Shock Waves, vol. 13, no. 6, pp. 413-429, 2004.
|
||||||||||||||||||||||||||||||||||||||||||||||||||||||||||||||||||
