Graph Quality
Abominable graphs
Significant figures. Return, BME315 , EMA611

[Rod Lakes Home]


green ball Summary
Graphs and diagrams enable the engineer or scientist to communicate quantitative material to others. A good graph clearly presents an idea to the reader without the need to excessively refer to the text for basic definitions. An introduction to graphical presentation is given by Tufte, E. R., The visual display of quantitative information, Graphics Press, Cheshire, Conn. (Box 430, Cheshire 06410) c1983. Remember that your graphs are to be read by a human being. The reader is as likely to suffer deadline pressure, fatigue, and stress as you, the writer. A good graph is a way to offer kindness to the reader. Good data display also encourages the reader to understand your results. By contrast, a poor graph can cause nausea and distress. Suggestions for dedicated graphics software are given at the bottom.

green ball Discussion of poor graphs
These graphs were submitted by students as part of assignments and project reports at several universities. They are illustrative of graphical presentation errors.

Graph A1
Graph A1 is lacking in units for both axes. Scale marks 1, 11, 21 for the horizontal axis are distracting and not helpful to the reader. Use 0, 10, 20.

Graph A1.1
Graph A1.1 above has odd scale marks which suggest a mathematical mystery, but which are unintentionally generated by software. Click on image for original color graph.

Graph A2
In Graph A2, scale marks such as 5.00E-05 are suitable for communicating with a computer in FORTRAN language. In early times (e. g. 1965), there was no graphical interface. The computer filled most of the room. Programs were submitted on punch cards, with one FORTRAN statement per card, for overnight processing. The notation is archaic and does not belong in a graph which you, as a human, will read. A human reader deserves better than old FORTRAN notation. Rather than 5.00E-05 use scientific notation (5 x 10⁻⁵) or Greek prefixes such as k for kilo, M for mega, Greek mu m for micro, n for nano, p for pico.
In Graph A2 the line at the top, created by software, means nothing to the reader. It is a distraction. Remove it.
In Graph A2 the scale marks in the horizontal axis should be in scientific notation. It is not acceptable to use large numbers of zeroes in communicating to readers versed in science or engineering.

Graph A3
In Graph A3, the horizontal axis is already logarithmic, therefore the label should say time, not log time.
In Graph A3 the scale marks in the vertical and also the horizontal axis should be in scientific notation. It is not acceptable to use large numbers of zeroes in communicating to readers versed in science or engineering. The label 1E+11 is ugly and hostile to the reader
In Graph A3 the proper units for compliance are inverse pascals rather than pascals (Pa).
In Graph A3 the caption elucidates nothing for the reader. Please explain more or delete the caption.

Graph A4
In Graph A4, the scale marks in the horizontal axis contain a ludicrous number of zeroes.
In Graph A4 the horizontal log scale has tick marks which repeat every 100 units rather than every 10 units. This is not a proper log scale.
These data are replotted below.

EarPlug
Inverse of the shear creep compliance J(t) vs. reduced time t.
  The data from Graph A4 are replotted here using graphics software, with attention to scale marks, the identification of points, proper units for physical variables and the physical meaning of the variable on the ordinate. The overlap of curves is a natural result of the type of experiment and analysis.
  Point shapes are chosen to aid the reader to distinguish among the data. Color could also be used to help the reader to visualize the data. Reports and publications are likely to be printed or duplicated in black and white, therefore point shapes should be sufficient to identify data in the absence of color.
  To further help the reader interpret the time axis, markers are added by the writer (not by software) to show one day and one year on the (horizontal) scale of seconds.


Graph A5
In Graph A5, the scale marks contain a ludicrous number of zeroes.
In Graph A5 the log scale contains a zero. That is mathematically impossible.
In Graph A5 the labels G1, G2, G3 tell the reader nothing. These labels would be better used to briefly inform the reader about the specimens and test conditions.


Graph A6
Graph A6 is a test. A trial data set was plotted using spreadsheet software, quickly, with the default settings. The gray background is a distraction and is not appropriate for journal articles or professional presentations. Default settings give FORTRAN type scale marks not suitable for a human reader. Axes in the middle of the plot frame can easily be obscured by data points, therefore the proper placement of axes and their labels is at the outside of the frame. One could perhaps generate a nice plot in half an hour using this software, draining time from other tasks. The same trial data set quickly plotted with graphics software (KaleidaGraph) generated the following:

Graph A7
Graph A7 plotted within 30 seconds: nicer and faster.


Graph A8
Graph A8 receives the Abominable Graph prize for Spring 2001.
The vertical scale marks contain a ludicrous number of zeroes.
At the top it says log time, at the bottom it says time. The horizontal scale marks are for time, on a log scale.
The time scale in the graph of this transient test should begin when the load is applied. Instead, the time scale in the graph begins when the scope is triggered in automatic (free running) mode. Such a scale does not make physical sense, since the relationship between time zero on the scale and the start of the test is random.

Graph A9
Graph A9 receives the Abominable Graph prize for Fall 2001.
Again, FORTRAN type scale marks.
The points are so sparse one cannot judge the shape of the curve. Since this curve was done theoretically, it is straightforward to generate more points.

Graph A11
Graph A11 has scale marks so fine they approach the resolution limit of the human eye. A magnified view is shown. This is tiring for the reader. Please be kind to the reader and avoid this sort of graph.
Graph A10
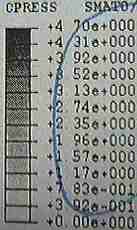
A10 is a figure legend for a calculated pressure distribution. 1.17e+000 is a painful and ugly way to say 1.17.
speed limit
Painful ways of representing numbers can slow you down.
All the prior diagrams are real diagrams, but mercifully this is not a real speed limit sign.


green ball Suggestions for better graphs

*Imagine that you are the reader. Imagine that the author of the graph has made an effort to make your reading of the graph as easy as possible. Now realize that, as the author, you have the ability to make that happen. Be kind to the reader.

*Axes should be clearly labeled and legible.

*Place units of measurement on each axis, usually right after the label. Enclose the units in parentheses.

*Do not use too many graduations along the axes. Grid lines should be used only if there is a definite reason for doing so.

*Do not use FORTRAN to communicate with human beings. Your reader is not a mainframe computer from 1965. If your data contain large numbers, use Greek prefixes such as G (giga), M (mega), or use scientific notation.

*If the origin does not appear on a graph with a linear scale, draw a break in the major axis so that the reader is immediately aware of this fact. Also draw a break if it is necessary for a good reason to have a scale change in the middle of a graph.

*Data points should be clearly marked by centered symbols. The reader should be able to differentiate symbols that belong to different data sets. Use symbols which are sufficiently large for the reader to distinguish a circle from a square from a spot of dirt. Keep in mind that graphs intended for publication are often reproduced at reduced size. If you have generated a curve-fit, never omit the original data points. If there are hundreds of data points which run together, use small symbols so the graph does not appear clotted. Tell the reader how many data points there are. Alternatively, plot every fifth or every tenth point, and tell the reader what you have done.

*Your reader may look at the graph first, prior to the text which explains it. The graph and its caption should be as self-explanatory as possible without becoming crowded or clotted.

*The caption is particularly important if your graph has multiple curves. If your graph is dense with data it will usually require more explanation than a sparse graph, either in writing (in a report or articles) or verbally (in a presentation). Data density which is acceptable in a written report may be excessive in a presentation.

*If several symbols are plotted together, make it clear to the reader which symbol is which.

*When different curves are to be distinguished, different symbols should be used for the points. The connecting lines or curve fits may be distinguished by thickness or by solid, dashed, or dotted lines. It is unwise to rely on color to distinguish among different lines. The colors will be lost during black and white copying or in printing in a journal. As for journal articles, color reproduction is expensive and only used when justified.

*Use graphics software, e.g. KaleidaGraph or EES (Engineering Equation Solver, S. A. Klein, University of Wisconsin) or MATLAB to do graphs, rather than spreadsheet software. Spreadsheet software does not excel at scientific or engineering graphs. KaleidaGraph has been available in the CAE system at Wisconsin via the following path: Start / CAE Applications / Productivity / KaleidaGraph. As of 2009, go Start / Course software. If you do not have access to graphics software, allow plenty of time to do the job well with tools available. Do not wait until the last minute.

Significant figures

Abominable presentations. Gettysburg Address Power point slide presentation.

funny power point video

more graphs

Top